Momentum in Motion
Momentum with our investment process is the idea that recent past performance tends to persist into the near future. ETFs or mutual funds that have done well in recent months often keep performing well, while those with poor recent results tend to continue performing poorly.
Think of it as Sir Isaac Newton’s first law of motion applied to investing: “A body in motion tends to stay in motion unless acted on by an outside force.”
This may appear to contradict a phrase you’ve heard many times, that “past performance is no guarantee of future results.” Relying on a strategy that assumes past performance will continue, may make you cautious. All investment prospectuses must include the “past performance” disclaimer. My compliance department requires the same disclaimer in my newsletters, for good reason. Past performance clearly doesn’t promise future returns, and an investment’s longer-term past performance (3, 5, or 10 years) has been shown to have virtually no predictive value.
That’s why mutual-fund rating systems that rely on those metrics, such as Morningstar’s star rankings, have proven to be such poor guides for choosing funds. According to a 2017 Wall Street Journal article1, “Of funds awarded a coveted five-star overall rating, only 12% did well enough over the next five years to earn a top rating for that period; 10% performed so poorly they were branded with a rock-bottom one-star rating.”
The Morningstar ratings are very influential in how many investors choose which funds to invest in. So influential, in fact, that a 2024 paper written by professors from Harvard, Boston College, and MIT2 said that some fund managers are finding ways to game the Morningstar system to garner higher ratings.
Fortunately, it has been proven that momentum, as measured by an investment’s recent performance, (3 – 12 months) can strongly predict its near-term future performance.
Think of it like this, as the football season hits the midway mark, which teams are most likely to make it to the Super Bowl — the teams that have won the most games over the past five years, or the teams that have won the most games recently? Of course, it’s the teams with the best records this year. The same tends to hold true with investments, such as mutual funds or ETFs.
There have been many studies over the years on momentum investing, but one of the most recent summaries of the last 159 years of data found that, “The evidence supporting momentum investing is about as strong as you’ll find in finance.” 3
Although momentum investing has an impressive long-term record, it can go through periods of underperformance — especially at market turning points. As a trend-following approach, momentum positions investors in what is working now. When a trend changes, it takes a little time to adjust a portfolio to the new trend.
HOW HAVE PORTFOILOS PERFORMED SO FAR THIS YEAR?
The first four months of 2026 have provided three distinct markets. From the beginning of the year through the end of February, you had a “Pre-war” period. While the S&P 500 was essentially flat, at -.60%, there were plenty of assets that performed well. Then you had the “Initial War” period of March 1 – 31.Lastly, we are in the “End Phase” period of the war. This timeframe saw the bounce off the market lows of March 27, when the Dow closed at 45,166 and the S&P 500 closed at 6,343 a trading day later.
What you will see in the chart below, is that the first time period resulted in very good returns for all asset allocations, compared to both the S&P 500 and the 60/40 Blend Index. Fortunately, those returns helped cushion the effects of the pull back due to the war (March). Year-to-date, following the bounce, momentum has returned to the positions that were performing well, prior to the disruption of the conflict in Iran.
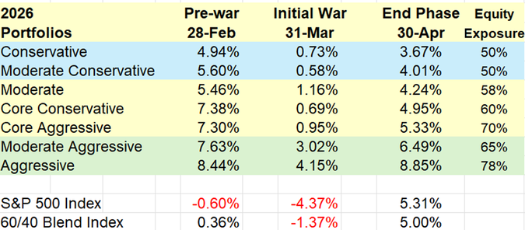
Reinhold Financial Portfolios by risk tolerance from the beginning of 2026 (Jan 2) ending at each date below by column.
As always, the over-arching goal is to “win by not losing.” Over each timeframe in the chart, that goal has been accomplished, and with lower risk. In this case, the definition of lower risk is less equity exposure, while achieving the same or better returns. Equities tend to be more volatile than fixed income and other alternatives. On the far right you can see the percentage of equities for each portfolio type.
TACTICAL ASSET ROTATION STRATEGY (TARS) RESULTS
The Core ETF Strategy is comprised of SPY (S&P 500), EFA (International), VNQ (Real Estate), IAU (Gold), IEF (7-10 mo. Treasuries), and BIL (Cash) and are evaluated on a relative strength basis and re-ranked 1 through 6. Clients are in the top 3. Typically, the CORE makes up 30% of a client portfolio. The Core TARS portfolio is designed to share in some of the bull market’s gains, while minimizing (or even preventing) losses during bear markets. “Win by not losing.”
The U.S. Stock Market fell throughout March as the Iran war grew more intense. After bottoming on March 30, it took off like a rocket. April’s turnaround saw the S&P 500 Index pivot from a -9% correction to a new all-time high in record time, with its +10% gain in just 10 trading days registering as one of the most dramatic rallies ever.
TARS Core had a very strong April in absolute terms, gaining +4.5%. While the Core was heavily invested in stocks, owning both U.S. and International Stocks, it also owned gold, which fell -1.49%, so the relative performance to S&P 500 and 60/40 Index wasn’t great. But then again, it wasn't rebounding out of a big negative hole either, so as the chart in the momentum article noted, when you don’t drop significantly, you don’t have to recover as much to still be ahead.
Year-to-date the Core ETF strategy is up 7.93%, compared to the S&P 500 up 5.31%, and the 60/40 blend index up 5.00%.
THE CORE STRATEGY
Here was the performance of the three Core asset classes for April1
US Stocks (SPY) + 10.51%
Small Cap Value (IWN)** + 9.64%
International (EFA) + 5.34%
Gold (IAU) - 1.49%
*Conservative, Moderate Conservative & Moderate allocations hold 50% SPY and 50% IWN.
**Moderate Aggressive & Aggressive allocations hold 0% SPY and 100% IWN.
There are no changes for April.
SECTOR ETFS
The TARS Sectors that are chosen based upon the same momentum strategy as the Core ETFs. I evaluate 85 Sectors and we make changes if they fall out of the top quartile.
While Biotechnology performed pretty well in April with a 2.82% return, it fell out of the top quartile. We are replacing it with the Invesco Optimum Yield Diversified Commodity Strategy (PDBC).For those clients that owned Invesco’s DBC fund in the past, I am happy to tell you that this is the “No K-1” version, so you don’t have to worry about that fiasco come tax time.
Here is the performance of the Sector ETFs for April4
Biotechnology (IBT)* + 2.82%
Aerospace & Defense (PPA)** + 1.06%
*Moderate & Moderate Aggressive allocations hold IBT
** Aggressive allocations hold PAA
There is one change this month. Sell Biotechnology (IBT) and Buy Commodities (PDBC).
WORLD ETFS
I evaluate 64 country and world ETFs. Aggressive portfolios hold a 5% allocation to 2 country ETFs and Moderate Aggressive have a 2.5% allocation each.
Both country ETFs performed well in April and remain in the top quartile. Although Spain is resting in last place in the top quartile and on my “watch list.”
Here is the performance of the World ETFs for April4
Spain (EWP) + 4.36%
Latin America (ILF) + 2.59%
There are no changes for April.
OTHER FUNDS
VYM continues to be a consistent performer and is doing exceptional well this year, up +10.10% YTD. It is not surprising that the Aegis Small Cap Value fund (AVALX) is doing well, seeing as the Core Strategy had us move out of Large Cap Growth and into Small Cap Value. YTD it is up +15.40%.
Here is the performance of these funds for April4
Vanguard High Dividend Yield Stock Fund (VYM)* + 6.14%
Aegis Small Cap Value (AVALX)** + 3.80%
*Conservative, Moderate Conservative, Moderate & Moderate Aggressive allocations hold VYM.
** Moderate Aggressive & Aggressive allocations hold AVALX.
FIXED INCOME ETFS
PAAA (PGIM’s AAA Ultra Short Bond Fund) makes 20% of Conservative allocations, 10% of Moderate Conservative and Moderate allocation, and 5% of Moderate Aggressive allocations. It has a current yield of 5.12%. FLOT floating rate has a 10% weighting in Conservative allocation. PIMCO’s PFN ETF has been swapped out for a less volatile PIMCO Mutual Fund – PIMIX.For Moderate Conservative and Moderate allocations, FLOT has been swapped out for the Guggenheim Macro Opportunities Fund (GIOIX).
For those in non-retirement accounts where we are seeking to limit taxable income, I have substituted the Short-term Nat’l Muni (SUB), North Square Tax-Advantaged Professional Income (QTPI), and PGIM Ultra Short Muni (PUSH).
Here is the performance of the fixed income funds in April4
PGIM AAA Ultra Short Bond (PAAA) + 0.59%
PGIM Short Term Muni (PUSH) + 0.27%
Short-term Nat’l Muni (SUB) + 0.28%
Invesco Floating Rate (FLOT) + 0.53%
Guggenheim Macro Opportunities (GIOIX) + 1.16%
PIMCO Income (PIMIX) + 0.82%
North Square Tax-Advantage Income (QTPI) + 1.50%
ALTERNATIVE HOLDINGS
The JP Morgan Equity Premium fund (JEPI), writes covered calls on S&P 500 holdings for additional premium returns yields 8.06%. Real Asset Allocation (RAA) is a diversified asset allocation fund that utilizes the same relative strength strategy as our Core Strategy with the inclusion of not just stocks, bonds, and gold, but commodities, metal miners, managed futures, Bitcoin, TIPS, Emerging Market Bonds, and more. RAA is currently 10-20% of every risk strategy. This year I also added a Commodities Fund (SDCI) to the Aggressive Growth allocations as a hedge against volatility and inflation. It is up 27.01% this year.
Here is the performance of the alternative funds in April4
Real Asset Allocation (RAA)* + 6.72%
JP Morgan Equity Premium (JEPI)** + 2.72%
SummerHaven Dynamic Commodity (SDCI)*** + 4.77%
*All portfolio allocations hold RAA
**All portfolio allocations except for Aggressive hold JEPI
***Aggressive Growth allocations hold SDCI
REFERENCES
The Wall Street Journal, “The Morningstar Mirage,” Kirsten Grind, Oct. 25, 2017.
Harvard Law School Forum on Corporate Governance, “Box Jumping: Portfolio Recompositions to Achieve Higher Morningstar Ratings, Lauren H. Cohen (Harvard Business School) and David Sunghyo Kim (MIT), Nov 6, 2024.
Financial Advisor Magazine, “Momentum Investing: What 159 Years of Data Tell Us,” Larry Swedroe, Jan. 29, 2026.
Morningstar April 30, 2026 Monthly Returns.
DISCLOSURES
The analysis and commentary in this Market Commentary is general in nature and does not take your personal circumstances into consideration. It is not intended to be a substitute for specific, individualized financial advice and investors should obtain legal, accounting and tax advice from a qualified tax professional, accountant or attorney.
The information provided in this Market Commentary, including any strategies, methodologies, and opinions, is expressed as of the date hereof and is subject to change. EverSource Wealth Advisors, LLC assumes no obligation to update or otherwise revise these materials.
This Market Commentary relies upon historical data, and much of the information presented is not intended to be performance reporting or representation, whether hypothetical or actual. Reports on the performance of various strategies are gross, not net, and do not take into account our fee or various third-party charges such as trading charges. Individual Exchange Traded Fund (ETF) performance in the commentary are monthly returns of all ETFs utilized across client accounts in various asset allocation percentages based upon risk tolerance. They are gross returns and not net of advisory fees. Each client’s returns will vary based upon the percentage of each ETF held, in addition to other variables, such as: allocations to money market funds, additional individual stocks or mutual funds held, and date of entry into each holding.
Actual results will vary from the analysis. Past performance should not be taken as an indication or guarantee of future performance, and no representation or warranty, expressed or implied is made regarding future performance or the accuracy of the information herein.
This material is provided for informational purposes, is intended for your use only, does not constitute an invitation, solicitation, or offer to subscribe for or purchase any of the products or services mentioned. It is likewise not a recommendation that you purchase, sell, or hold any security or other investment or pursue any investment style or strategy.